

Summary: This example shows how to alter the display options that control the html output that contains plotly charts
You can control the html output that gets created (e.g. documents created with Chart.Show or the output of GenericChart.toChartHTML) with various functions that change a chart's DisplayOptions.
Let's first create some data for the purpose of creating example charts:
open Plotly.NET

let x = [ 1.; 2.; 3.; 4.; 5.; 6.; 7.; 8.; 9.; 10. ]
let y = [ 2.; 1.5; 5.; 1.5; 3.; 2.5; 2.5; 1.5; 3.5; 1. ]
For rendering plotly.js charts in a html document, the document needs to reference plotly.js in some form.
Plotly.NET has two fundamentally different html outputs:
-
Full html documents, containing <head> tags.
Functions that generate these files are:
-
html fragments, containing only some html tags (e.g. a <div> containing a chart generation script). This is usually meant to included into another document that contains a reference to plotly.js.
Functions that generate these fragments are:
Plotly.NET provides multiple ways to reference plotly.js in generated html via the PlotlyJSReference type. These differ in their effect depending on if the output is a full html document or a fragment:
Full
|
Include the full plotly.js source. |
HTML documents created using this option are self-contained and can be used offline. |
No effect |
CDN
|
(default) Include a reference to plotly.js from a CDN. |
HTML documents created using this option will contain a reference in their <head> tag |
No effect |
Require
|
Use requirejs to load plotly. |
HTML documents created using this option will programmatically add a reference to require.js in their <head> tag which will then be used to load plotly.js |
Fragments created using this option will programmatically add a reference to require.js when embedded into a html document which will then be used to load plotly.js. |
NoReference
|
Don't include any plotly.js reference. Useful if you want to embed the output into another page that already references plotly - the documentation pages you are reading now are generated with this option. |
No effect |
No effect |
You can control this on a per-chart basis via Chart.withDisplayOptionsStyle, for example if you want to include a script tag with the full plotly.js source:
Chart.Point(x = x, y = y)
|> Chart.withDisplayOptionsStyle (PlotlyJSReference = Full)
Plotly.NET uses Giraffe.ViewEngine internally to generate HTML documents, which means you can also use that DSL to add additional content to the output.
For example, use Chart.withDescription to append a list of html tags below the rendered chart:
open Giraffe.ViewEngine

let desc1 =
    Chart.Point(x = x, y = y, Name = "desc1")
    |> Chart.withDescription
        [ h1 [] [ str "Hello" ]
          p [] [ str "F#" ]
          ol [] [ li [] [ str "Item 1" ]; li [] [ str "Item 2" ] ] ]
Note: the example here is shown via an image, as the docs themselves are html pages that cannot load additional head tags.
You can add any number of additional html tags to document <head> tag using Chart.WithAdditionalHeadTags.
For example, you can load external css libraries to style the chart description:
//html for description containing bulma classes such as "hero"
let bulmaHero =
    section
        [ _class "hero is-primary is-bold" ]
        [ div
              [ _class "hero-body" ]
              [ p [ _class "title" ] [ str "Hero title" ]
                p [ _class "subtitle" ] [ str "Hero subtitle" ] ] ]
// chart description containing bulma classes
let description3 = [ h1 [ _class "title" ] [ str "I am heading" ]; bulmaHero ]

let desc3 =
    Chart.Point(x = x, y = y, Name = "desc3")
    |> Chart.withAdditionalHeadTags
        [ link
              [ _rel "stylesheet"
                _href "https://cdn.jsdelivr.net/npm/bulma@0.9.2/css/bulma.min.css" ] ]
    |> Chart.withDescription description3
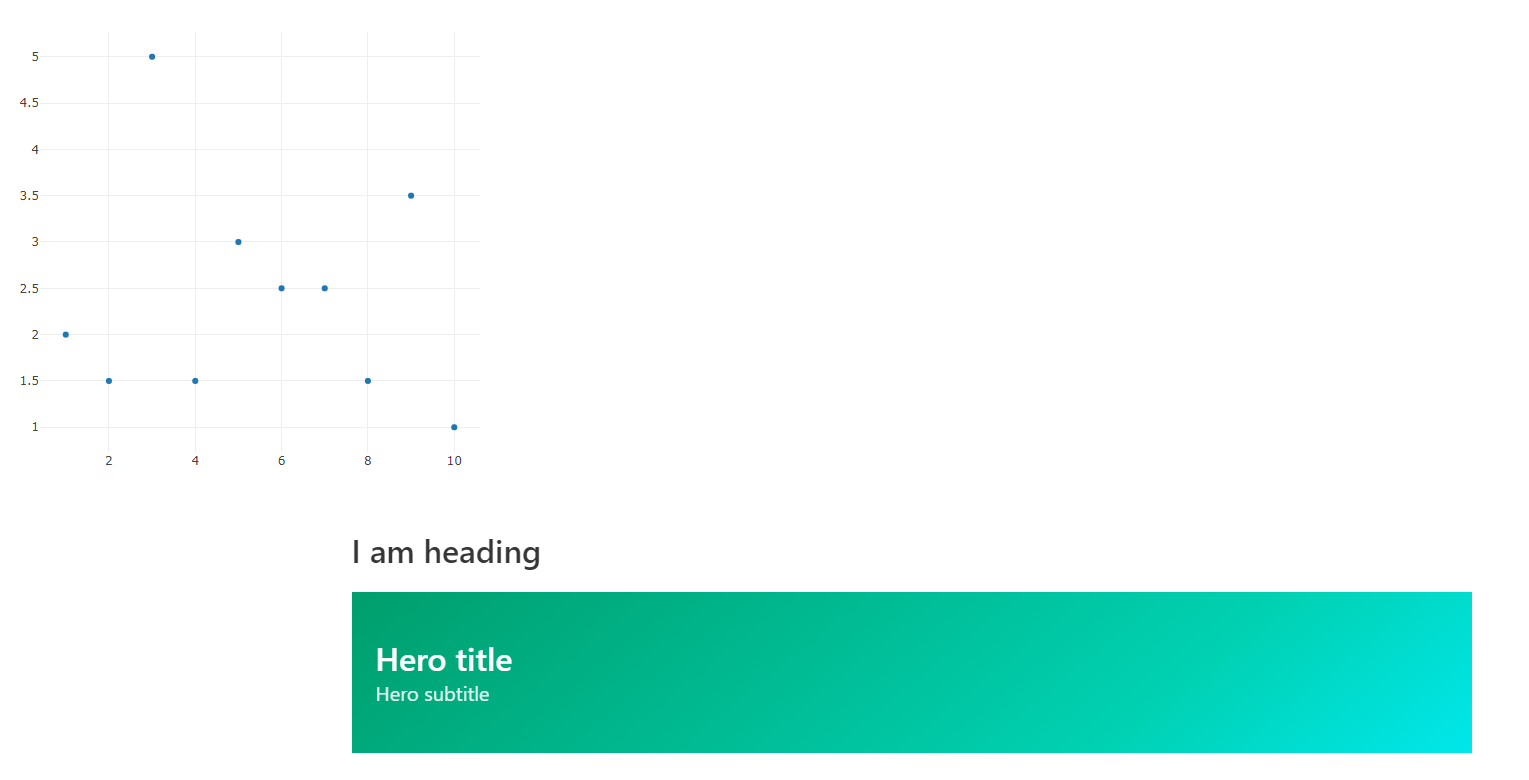
Chart.WithMathTex is a prebuilt function to enable MathTeX for your generated plotly chart documents.
It will add a MathJax script reference to your document based on which version (either 2 or 3) you want to use:
let mathtex_chart =
    [ Chart.Point(xy = [ (1., 2.) ], Name = @"$\beta_{1c} = 25 \pm 11 \text{ km s}^{-1}$")
      Chart.Point(xy = [ (2., 4.) ], Name = @"$\beta_{1c} = 25 \pm 11 \text{ km s}^{-1}$") ]
    |> Chart.combine
    |> Chart.withTitle @"$\beta_{1c} = 25 \pm 11 \text{ km s}^{-1}$"
    |> Chart.withMathTex (AppendTags = true, MathJaxVersion = 3)
namespace Plotly
namespace Plotly.NET
module Defaults
from Plotly.NET
<summary>
Contains mutable global default values.
Changing these values will apply the default values to all consecutive Chart generations.
</summary>
val mutable DefaultDisplayOptions: DisplayOptions
Multiple items
type DisplayOptions =
inherit DynamicObj
new: unit -> DisplayOptions
static member addAdditionalHeadTags: additionalHeadTags: XmlNode list -> (DisplayOptions -> DisplayOptions)
static member addChartDescription: description: XmlNode list -> (DisplayOptions -> DisplayOptions)
static member combine: first: DisplayOptions -> second: DisplayOptions -> DisplayOptions
static member getAdditionalHeadTags: displayOpts: DisplayOptions -> XmlNode list
static member getChartDescription: displayOpts: DisplayOptions -> XmlNode list
static member getDocumentCharset: displayOpts: DisplayOptions -> string
static member getDocumentDescription: displayOpts: DisplayOptions -> string
static member getDocumentFavicon: displayOpts: DisplayOptions -> XmlNode
...
--------------------
new: unit -> DisplayOptions
static member DisplayOptions.init: [<System.Runtime.InteropServices.Optional; System.Runtime.InteropServices.DefaultParameterValue ((null :> obj))>] ?DocumentTitle: string * [<System.Runtime.InteropServices.Optional; System.Runtime.InteropServices.DefaultParameterValue ((null :> obj))>] ?DocumentCharset: string * [<System.Runtime.InteropServices.Optional; System.Runtime.InteropServices.DefaultParameterValue ((null :> obj))>] ?DocumentDescription: string * [<System.Runtime.InteropServices.Optional; System.Runtime.InteropServices.DefaultParameterValue ((null :> obj))>] ?DocumentFavicon: XmlNode * [<System.Runtime.InteropServices.Optional; System.Runtime.InteropServices.DefaultParameterValue ((null :> obj))>] ?AdditionalHeadTags: XmlNode list * [<System.Runtime.InteropServices.Optional; System.Runtime.InteropServices.DefaultParameterValue ((null :> obj))>] ?ChartDescription: XmlNode list * [<System.Runtime.InteropServices.Optional; System.Runtime.InteropServices.DefaultParameterValue ((null :> obj))>] ?PlotlyJSReference: PlotlyJSReference -> DisplayOptions
type PlotlyJSReference =
| CDN of string
| Full
| Require of string
| NoReference
<summary>
Sets how plotly is referenced in the head of html docs.
</summary>
union case PlotlyJSReference.NoReference: PlotlyJSReference
val x: float list
val y: float list
type Chart =
static member AnnotatedHeatmap: zData: #('b seq) seq * annotationText: #(string seq) seq * [<Optional; DefaultParameterValue ((null :> obj))>] ?Name: string * [<Optional; DefaultParameterValue ((null :> obj))>] ?ShowLegend: bool * [<Optional; DefaultParameterValue ((null :> obj))>] ?Opacity: float * [<Optional; DefaultParameterValue ((null :> obj))>] ?X: 'd seq * [<Optional; DefaultParameterValue ((null :> obj))>] ?MultiX: 'd seq seq * [<Optional; DefaultParameterValue ((null :> obj))>] ?XGap: int * [<Optional; DefaultParameterValue ((null :> obj))>] ?Y: 'e seq * [<Optional; DefaultParameterValue ((null :> obj))>] ?MultiY: 'e seq seq * [<Optional; DefaultParameterValue ((null :> obj))>] ?YGap: int * [<Optional; DefaultParameterValue ((null :> obj))>] ?Text: 'f * [<Optional; DefaultParameterValue ((null :> obj))>] ?MultiText: 'f seq * [<Optional; DefaultParameterValue ((null :> obj))>] ?ColorBar: ColorBar * [<Optional; DefaultParameterValue ((null :> obj))>] ?ColorScale: Colorscale * [<Optional; DefaultParameterValue ((null :> obj))>] ?ShowScale: bool * [<Optional; DefaultParameterValue ((null :> obj))>] ?ReverseScale: bool * [<Optional; DefaultParameterValue ((null :> obj))>] ?ZSmooth: SmoothAlg * [<Optional; DefaultParameterValue ((null :> obj))>] ?Transpose: bool * [<Optional; DefaultParameterValue ((false :> obj))>] ?UseWebGL: bool * [<Optional; DefaultParameterValue ((false :> obj))>] ?ReverseYAxis: bool * [<Optional; DefaultParameterValue ((true :> obj))>] ?UseDefaults: bool -> GenericChart (requires 'b :> IConvertible and 'd :> IConvertible and 'e :> IConvertible and 'f :> IConvertible) + 1 overload
static member Area: x: #IConvertible seq * y: #IConvertible seq * [<Optional; DefaultParameterValue ((null :> obj))>] ?ShowMarkers: bool * [<Optional; DefaultParameterValue ((null :> obj))>] ?Name: string * [<Optional; DefaultParameterValue ((null :> obj))>] ?ShowLegend: bool * [<Optional; DefaultParameterValue ((null :> obj))>] ?Opacity: float * [<Optional; DefaultParameterValue ((null :> obj))>] ?MultiOpacity: float seq * [<Optional; DefaultParameterValue ((null :> obj))>] ?Text: 'c * [<Optional; DefaultParameterValue ((null :> obj))>] ?MultiText: 'c seq * [<Optional; DefaultParameterValue ((null :> obj))>] ?TextPosition: TextPosition * [<Optional; DefaultParameterValue ((null :> obj))>] ?MultiTextPosition: TextPosition seq * [<Optional; DefaultParameterValue ((null :> obj))>] ?MarkerColor: Color * [<Optional; DefaultParameterValue ((null :> obj))>] ?MarkerColorScale: Colorscale * [<Optional; DefaultParameterValue ((null :> obj))>] ?MarkerOutline: Line * [<Optional; DefaultParameterValue ((null :> obj))>] ?MarkerSymbol: MarkerSymbol * [<Optional; DefaultParameterValue ((null :> obj))>] ?MultiMarkerSymbol: MarkerSymbol seq * [<Optional; DefaultParameterValue ((null :> obj))>] ?Marker: Marker * [<Optional; DefaultParameterValue ((null :> obj))>] ?LineColor: Color * [<Optional; DefaultParameterValue ((null :> obj))>] ?LineColorScale: Colorscale * [<Optional; DefaultParameterValue ((null :> obj))>] ?LineWidth: float * [<Optional; DefaultParameterValue ((null :> obj))>] ?LineDash: DrawingStyle * [<Optional; DefaultParameterValue ((null :> obj))>] ?Line: Line * [<Optional; DefaultParameterValue ((null :> obj))>] ?AlignmentGroup: string * [<Optional; DefaultParameterValue ((null :> obj))>] ?OffsetGroup: string * [<Optional; DefaultParameterValue ((null :> obj))>] ?StackGroup: string * [<Optional; DefaultParameterValue ((null :> obj))>] ?Orientation: Orientation * [<Optional; DefaultParameterValue ((null :> obj))>] ?GroupNorm: GroupNorm * [<Optional; DefaultParameterValue ((null :> obj))>] ?FillColor: Color * [<Optional; DefaultParameterValue ((null :> obj))>] ?FillPatternShape: PatternShape * [<Optional; DefaultParameterValue ((null :> obj))>] ?FillPattern: Pattern * [<Optional; DefaultParameterValue ((false :> obj))>] ?UseWebGL: bool * [<Optional; DefaultParameterValue ((true :> obj))>] ?UseDefaults: bool -> GenericChart (requires 'c :> IConvertible) + 1 overload
static member Bar: values: #IConvertible seq * [<Optional; DefaultParameterValue ((null :> obj))>] ?Keys: 'b seq * [<Optional; DefaultParameterValue ((null :> obj))>] ?MultiKeys: 'b seq seq * [<Optional; DefaultParameterValue ((null :> obj))>] ?Name: string * [<Optional; DefaultParameterValue ((null :> obj))>] ?ShowLegend: bool * [<Optional; DefaultParameterValue ((null :> obj))>] ?Opacity: float * [<Optional; DefaultParameterValue ((null :> obj))>] ?MultiOpacity: float seq * [<Optional; DefaultParameterValue ((null :> obj))>] ?Text: 'c * [<Optional; DefaultParameterValue ((null :> obj))>] ?MultiText: 'c seq * [<Optional; DefaultParameterValue ((null :> obj))>] ?MarkerColor: Color * [<Optional; DefaultParameterValue ((null :> obj))>] ?MarkerColorScale: Colorscale * [<Optional; DefaultParameterValue ((null :> obj))>] ?MarkerOutline: Line * [<Optional; DefaultParameterValue ((null :> obj))>] ?MarkerPatternShape: PatternShape * [<Optional; DefaultParameterValue ((null :> obj))>] ?MultiMarkerPatternShape: PatternShape seq * [<Optional; DefaultParameterValue ((null :> obj))>] ?MarkerPattern: Pattern * [<Optional; DefaultParameterValue ((null :> obj))>] ?Marker: Marker * [<Optional; DefaultParameterValue ((null :> obj))>] ?Base: #IConvertible * [<Optional; DefaultParameterValue ((null :> obj))>] ?Width: 'e * [<Optional; DefaultParameterValue ((null :> obj))>] ?MultiWidth: 'e seq * [<Optional; DefaultParameterValue ((null :> obj))>] ?TextPosition: TextPosition * [<Optional; DefaultParameterValue ((null :> obj))>] ?MultiTextPosition: TextPosition seq * [<Optional; DefaultParameterValue ((true :> obj))>] ?UseDefaults: bool -> GenericChart (requires 'b :> IConvertible and 'c :> IConvertible and 'e :> IConvertible) + 1 overload
static member BoxPlot: [<Optional; DefaultParameterValue ((null :> obj))>] ?X: 'a seq * [<Optional; DefaultParameterValue ((null :> obj))>] ?MultiX: 'a seq seq * [<Optional; DefaultParameterValue ((null :> obj))>] ?Y: 'b seq * [<Optional; DefaultParameterValue ((null :> obj))>] ?MultiY: 'b seq seq * [<Optional; DefaultParameterValue ((null :> obj))>] ?Name: string * [<Optional; DefaultParameterValue ((null :> obj))>] ?ShowLegend: bool * [<Optional; DefaultParameterValue ((null :> obj))>] ?Text: 'c * [<Optional; DefaultParameterValue ((null :> obj))>] ?MultiText: 'c seq * [<Optional; DefaultParameterValue ((null :> obj))>] ?FillColor: Color * [<Optional; DefaultParameterValue ((null :> obj))>] ?MarkerColor: Color * [<Optional; DefaultParameterValue ((null :> obj))>] ?Marker: Marker * [<Optional; DefaultParameterValue ((null :> obj))>] ?Opacity: float * [<Optional; DefaultParameterValue ((null :> obj))>] ?WhiskerWidth: float * [<Optional; DefaultParameterValue ((null :> obj))>] ?BoxPoints: BoxPoints * [<Optional; DefaultParameterValue ((null :> obj))>] ?BoxMean: BoxMean * [<Optional; DefaultParameterValue ((null :> obj))>] ?Jitter: float * [<Optional; DefaultParameterValue ((null :> obj))>] ?PointPos: float * [<Optional; DefaultParameterValue ((null :> obj))>] ?Orientation: Orientation * [<Optional; DefaultParameterValue ((null :> obj))>] ?OutlineColor: Color * [<Optional; DefaultParameterValue ((null :> obj))>] ?OutlineWidth: float * [<Optional; DefaultParameterValue ((null :> obj))>] ?Outline: Line * [<Optional; DefaultParameterValue ((null :> obj))>] ?AlignmentGroup: string * [<Optional; DefaultParameterValue ((null :> obj))>] ?OffsetGroup: string * [<Optional; DefaultParameterValue ((null :> obj))>] ?Notched: bool * [<Optional; DefaultParameterValue ((null :> obj))>] ?NotchWidth: float * [<Optional; DefaultParameterValue ((null :> obj))>] ?QuartileMethod: QuartileMethod * [<Optional; DefaultParameterValue ((null :> obj))>] ?SizeMode: BoxSizeMode * [<Optional; DefaultParameterValue ((true :> obj))>] ?UseDefaults: bool -> GenericChart (requires 'a :> IConvertible and 'b :> IConvertible and 'c :> IConvertible) + 2 overloads
static member Bubble: x: #IConvertible seq * y: #IConvertible seq * sizes: int seq * [<Optional; DefaultParameterValue ((null :> obj))>] ?Name: string * [<Optional; DefaultParameterValue ((null :> obj))>] ?ShowLegend: bool * [<Optional; DefaultParameterValue ((null :> obj))>] ?Opacity: float * [<Optional; DefaultParameterValue ((null :> obj))>] ?MultiOpacity: float seq * [<Optional; DefaultParameterValue ((null :> obj))>] ?Text: 'c * [<Optional; DefaultParameterValue ((null :> obj))>] ?MultiText: 'c seq * [<Optional; DefaultParameterValue ((null :> obj))>] ?TextPosition: TextPosition * [<Optional; DefaultParameterValue ((null :> obj))>] ?MultiTextPosition: TextPosition seq * [<Optional; DefaultParameterValue ((null :> obj))>] ?MarkerColor: Color * [<Optional; DefaultParameterValue ((null :> obj))>] ?MarkerColorScale: Colorscale * [<Optional; DefaultParameterValue ((null :> obj))>] ?MarkerOutline: Line * [<Optional; DefaultParameterValue ((null :> obj))>] ?MarkerSymbol: MarkerSymbol * [<Optional; DefaultParameterValue ((null :> obj))>] ?MultiMarkerSymbol: MarkerSymbol seq * [<Optional; DefaultParameterValue ((null :> obj))>] ?Marker: Marker * [<Optional; DefaultParameterValue ((null :> obj))>] ?LineColor: Color * [<Optional; DefaultParameterValue ((null :> obj))>] ?LineColorScale: Colorscale * [<Optional; DefaultParameterValue ((null :> obj))>] ?LineWidth: float * [<Optional; DefaultParameterValue ((null :> obj))>] ?LineDash: DrawingStyle * [<Optional; DefaultParameterValue ((null :> obj))>] ?Line: Line * [<Optional; DefaultParameterValue ((null :> obj))>] ?AlignmentGroup: string * [<Optional; DefaultParameterValue ((null :> obj))>] ?OffsetGroup: string * [<Optional; DefaultParameterValue ((null :> obj))>] ?StackGroup: string * [<Optional; DefaultParameterValue ((null :> obj))>] ?Orientation: Orientation * [<Optional; DefaultParameterValue ((null :> obj))>] ?GroupNorm: GroupNorm * [<Optional; DefaultParameterValue ((false :> obj))>] ?UseWebGL: bool * [<Optional; DefaultParameterValue ((true :> obj))>] ?UseDefaults: bool -> GenericChart (requires 'c :> IConvertible) + 1 overload
static member Candlestick: ``open`` : #IConvertible seq * high: #IConvertible seq * low: #IConvertible seq * close: #IConvertible seq * [<Optional; DefaultParameterValue ((null :> obj))>] ?X: 'e seq * [<Optional; DefaultParameterValue ((null :> obj))>] ?MultiX: 'e seq seq * [<Optional; DefaultParameterValue ((null :> obj))>] ?Name: string * [<Optional; DefaultParameterValue ((null :> obj))>] ?ShowLegend: bool * [<Optional; DefaultParameterValue ((null :> obj))>] ?Opacity: float * [<Optional; DefaultParameterValue ((null :> obj))>] ?Text: 'f * [<Optional; DefaultParameterValue ((null :> obj))>] ?MultiText: 'f seq * [<Optional; DefaultParameterValue ((null :> obj))>] ?Line: Line * [<Optional; DefaultParameterValue ((null :> obj))>] ?IncreasingColor: Color * [<Optional; DefaultParameterValue ((null :> obj))>] ?Increasing: FinanceMarker * [<Optional; DefaultParameterValue ((null :> obj))>] ?DecreasingColor: Color * [<Optional; DefaultParameterValue ((null :> obj))>] ?Decreasing: FinanceMarker * [<Optional; DefaultParameterValue ((null :> obj))>] ?WhiskerWidth: float * [<Optional; DefaultParameterValue ((true :> obj))>] ?ShowXAxisRangeSlider: bool * [<Optional; DefaultParameterValue ((true :> obj))>] ?UseDefaults: bool -> GenericChart (requires 'e :> IConvertible and 'f :> IConvertible) + 2 overloads
static member Column: values: #IConvertible seq * [<Optional; DefaultParameterValue ((null :> obj))>] ?Keys: 'b seq * [<Optional; DefaultParameterValue ((null :> obj))>] ?MultiKeys: 'b seq seq * [<Optional; DefaultParameterValue ((null :> obj))>] ?Name: string * [<Optional; DefaultParameterValue ((null :> obj))>] ?ShowLegend: bool * [<Optional; DefaultParameterValue ((null :> obj))>] ?Opacity: float * [<Optional; DefaultParameterValue ((null :> obj))>] ?MultiOpacity: float seq * [<Optional; DefaultParameterValue ((null :> obj))>] ?Text: 'c * [<Optional; DefaultParameterValue ((null :> obj))>] ?MultiText: 'c seq * [<Optional; DefaultParameterValue ((null :> obj))>] ?MarkerColor: Color * [<Optional; DefaultParameterValue ((null :> obj))>] ?MarkerColorScale: Colorscale * [<Optional; DefaultParameterValue ((null :> obj))>] ?MarkerOutline: Line * [<Optional; DefaultParameterValue ((null :> obj))>] ?MarkerPatternShape: PatternShape * [<Optional; DefaultParameterValue ((null :> obj))>] ?MultiMarkerPatternShape: PatternShape seq * [<Optional; DefaultParameterValue ((null :> obj))>] ?MarkerPattern: Pattern * [<Optional; DefaultParameterValue ((null :> obj))>] ?Marker: Marker * [<Optional; DefaultParameterValue ((null :> obj))>] ?Base: #IConvertible * [<Optional; DefaultParameterValue ((null :> obj))>] ?Width: 'e * [<Optional; DefaultParameterValue ((null :> obj))>] ?MultiWidth: 'e seq * [<Optional; DefaultParameterValue ((null :> obj))>] ?TextPosition: TextPosition * [<Optional; DefaultParameterValue ((null :> obj))>] ?MultiTextPosition: TextPosition seq * [<Optional; DefaultParameterValue ((true :> obj))>] ?UseDefaults: bool -> GenericChart (requires 'b :> IConvertible and 'c :> IConvertible and 'e :> IConvertible) + 1 overload
static member Contour: zData: #('b seq) seq * [<Optional; DefaultParameterValue ((null :> obj))>] ?Name: string * [<Optional; DefaultParameterValue ((null :> obj))>] ?ShowLegend: bool * [<Optional; DefaultParameterValue ((null :> obj))>] ?Opacity: float * [<Optional; DefaultParameterValue ((null :> obj))>] ?X: 'c seq * [<Optional; DefaultParameterValue ((null :> obj))>] ?MultiX: 'c seq seq * [<Optional; DefaultParameterValue ((null :> obj))>] ?Y: 'd seq * [<Optional; DefaultParameterValue ((null :> obj))>] ?MultiY: 'd seq seq * [<Optional; DefaultParameterValue ((null :> obj))>] ?Text: 'e * [<Optional; DefaultParameterValue ((null :> obj))>] ?MultiText: 'e seq * [<Optional; DefaultParameterValue ((null :> obj))>] ?ColorBar: ColorBar * [<Optional; DefaultParameterValue ((null :> obj))>] ?ColorScale: Colorscale * [<Optional; DefaultParameterValue ((null :> obj))>] ?ShowScale: bool * [<Optional; DefaultParameterValue ((null :> obj))>] ?ReverseScale: bool * [<Optional; DefaultParameterValue ((null :> obj))>] ?Transpose: bool * [<Optional; DefaultParameterValue ((null :> obj))>] ?ContourLinesColor: Color * [<Optional; DefaultParameterValue ((null :> obj))>] ?ContourLinesDash: DrawingStyle * [<Optional; DefaultParameterValue ((null :> obj))>] ?ContourLinesSmoothing: float * [<Optional; DefaultParameterValue ((null :> obj))>] ?ContourLinesWidth: float * [<Optional; DefaultParameterValue ((null :> obj))>] ?ContourLines: Line * [<Optional; DefaultParameterValue ((null :> obj))>] ?ShowContourLines: bool * [<Optional; DefaultParameterValue ((null :> obj))>] ?ContoursColoring: ContourColoring * [<Optional; DefaultParameterValue ((null :> obj))>] ?ContoursOperation: ConstraintOperation * [<Optional; DefaultParameterValue ((null :> obj))>] ?ContoursType: ContourType * [<Optional; DefaultParameterValue ((null :> obj))>] ?ShowContoursLabels: bool * [<Optional; DefaultParameterValue ((null :> obj))>] ?ContoursLabelFont: Font * [<Optional; DefaultParameterValue ((null :> obj))>] ?ContoursStart: float * [<Optional; DefaultParameterValue ((null :> obj))>] ?ContoursEnd: float * [<Optional; DefaultParameterValue ((null :> obj))>] ?Contours: Contours * [<Optional; DefaultParameterValue ((null :> obj))>] ?FillColor: Color * [<Optional; DefaultParameterValue ((null :> obj))>] ?NContours: int * [<Optional; DefaultParameterValue ((true :> obj))>] ?UseDefaults: bool -> GenericChart (requires 'b :> IConvertible and 'c :> IConvertible and 'd :> IConvertible and 'e :> IConvertible)
static member Funnel: x: #IConvertible seq * y: #IConvertible seq * [<Optional; DefaultParameterValue ((null :> obj))>] ?Name: string * [<Optional; DefaultParameterValue ((null :> obj))>] ?ShowLegend: bool * [<Optional; DefaultParameterValue ((null :> obj))>] ?Opacity: float * [<Optional; DefaultParameterValue ((null :> obj))>] ?Width: float * [<Optional; DefaultParameterValue ((null :> obj))>] ?Offset: float * [<Optional; DefaultParameterValue ((null :> obj))>] ?Text: 'c * [<Optional; DefaultParameterValue ((null :> obj))>] ?MultiText: 'c seq * [<Optional; DefaultParameterValue ((null :> obj))>] ?TextPosition: TextPosition * [<Optional; DefaultParameterValue ((null :> obj))>] ?MultiTextPosition: TextPosition seq * [<Optional; DefaultParameterValue ((null :> obj))>] ?Orientation: Orientation * [<Optional; DefaultParameterValue ((null :> obj))>] ?AlignmentGroup: string * [<Optional; DefaultParameterValue ((null :> obj))>] ?OffsetGroup: string * [<Optional; DefaultParameterValue ((null :> obj))>] ?MarkerColor: Color * [<Optional; DefaultParameterValue ((null :> obj))>] ?MarkerOutline: Line * [<Optional; DefaultParameterValue ((null :> obj))>] ?Marker: Marker * [<Optional; DefaultParameterValue ((null :> obj))>] ?TextInfo: TextInfo * [<Optional; DefaultParameterValue ((null :> obj))>] ?ConnectorLineColor: Color * [<Optional; DefaultParameterValue ((null :> obj))>] ?ConnectorLineStyle: DrawingStyle * [<Optional; DefaultParameterValue ((null :> obj))>] ?ConnectorFillColor: Color * [<Optional; DefaultParameterValue ((null :> obj))>] ?ConnectorLine: Line * [<Optional; DefaultParameterValue ((null :> obj))>] ?Connector: FunnelConnector * [<Optional; DefaultParameterValue ((null :> obj))>] ?InsideTextFont: Font * [<Optional; DefaultParameterValue ((null :> obj))>] ?OutsideTextFont: Font * [<Optional; DefaultParameterValue ((true :> obj))>] ?UseDefaults: bool -> GenericChart (requires 'c :> IConvertible)
static member Heatmap: zData: #('b seq) seq * [<Optional; DefaultParameterValue ((null :> obj))>] ?X: 'c seq * [<Optional; DefaultParameterValue ((null :> obj))>] ?MultiX: 'c seq seq * [<Optional; DefaultParameterValue ((null :> obj))>] ?Y: 'd seq * [<Optional; DefaultParameterValue ((null :> obj))>] ?MultiY: 'd seq seq * [<Optional; DefaultParameterValue ((null :> obj))>] ?Name: string * [<Optional; DefaultParameterValue ((null :> obj))>] ?ShowLegend: bool * [<Optional; DefaultParameterValue ((null :> obj))>] ?Opacity: float * [<Optional; DefaultParameterValue ((null :> obj))>] ?XGap: int * [<Optional; DefaultParameterValue ((null :> obj))>] ?YGap: int * [<Optional; DefaultParameterValue ((null :> obj))>] ?Text: 'e * [<Optional; DefaultParameterValue ((null :> obj))>] ?MultiText: 'e seq * [<Optional; DefaultParameterValue ((null :> obj))>] ?ColorBar: ColorBar * [<Optional; DefaultParameterValue ((null :> obj))>] ?ColorScale: Colorscale * [<Optional; DefaultParameterValue ((null :> obj))>] ?ShowScale: bool * [<Optional; DefaultParameterValue ((null :> obj))>] ?ReverseScale: bool * [<Optional; DefaultParameterValue ((null :> obj))>] ?ZSmooth: SmoothAlg * [<Optional; DefaultParameterValue ((null :> obj))>] ?Transpose: bool * [<Optional; DefaultParameterValue ((false :> obj))>] ?UseWebGL: bool * [<Optional; DefaultParameterValue ((false :> obj))>] ?ReverseYAxis: bool * [<Optional; DefaultParameterValue ((true :> obj))>] ?UseDefaults: bool -> GenericChart (requires 'b :> IConvertible and 'c :> IConvertible and 'd :> IConvertible and 'e :> IConvertible) + 1 overload
...
static member Chart.Point: xy: (#System.IConvertible * #System.IConvertible) seq * [<System.Runtime.InteropServices.Optional; System.Runtime.InteropServices.DefaultParameterValue ((null :> obj))>] ?Name: string * [<System.Runtime.InteropServices.Optional; System.Runtime.InteropServices.DefaultParameterValue ((null :> obj))>] ?ShowLegend: bool * [<System.Runtime.InteropServices.Optional; System.Runtime.InteropServices.DefaultParameterValue ((null :> obj))>] ?Opacity: float * [<System.Runtime.InteropServices.Optional; System.Runtime.InteropServices.DefaultParameterValue ((null :> obj))>] ?MultiOpacity: float seq * [<System.Runtime.InteropServices.Optional; System.Runtime.InteropServices.DefaultParameterValue ((null :> obj))>] ?Text: 'c * [<System.Runtime.InteropServices.Optional; System.Runtime.InteropServices.DefaultParameterValue ((null :> obj))>] ?MultiText: 'c seq * [<System.Runtime.InteropServices.Optional; System.Runtime.InteropServices.DefaultParameterValue ((null :> obj))>] ?TextPosition: StyleParam.TextPosition * [<System.Runtime.InteropServices.Optional; System.Runtime.InteropServices.DefaultParameterValue ((null :> obj))>] ?MultiTextPosition: StyleParam.TextPosition seq * [<System.Runtime.InteropServices.Optional; System.Runtime.InteropServices.DefaultParameterValue ((null :> obj))>] ?MarkerColor: Color * [<System.Runtime.InteropServices.Optional; System.Runtime.InteropServices.DefaultParameterValue ((null :> obj))>] ?MarkerColorScale: StyleParam.Colorscale * [<System.Runtime.InteropServices.Optional; System.Runtime.InteropServices.DefaultParameterValue ((null :> obj))>] ?MarkerOutline: Line * [<System.Runtime.InteropServices.Optional; System.Runtime.InteropServices.DefaultParameterValue ((null :> obj))>] ?MarkerSymbol: StyleParam.MarkerSymbol * [<System.Runtime.InteropServices.Optional; System.Runtime.InteropServices.DefaultParameterValue ((null :> obj))>] ?MultiMarkerSymbol: StyleParam.MarkerSymbol seq * [<System.Runtime.InteropServices.Optional; System.Runtime.InteropServices.DefaultParameterValue ((null :> obj))>] ?Marker: TraceObjects.Marker * [<System.Runtime.InteropServices.Optional; System.Runtime.InteropServices.DefaultParameterValue ((null :> obj))>] ?AlignmentGroup: string * [<System.Runtime.InteropServices.Optional; System.Runtime.InteropServices.DefaultParameterValue ((null :> obj))>] ?OffsetGroup: string * [<System.Runtime.InteropServices.Optional; System.Runtime.InteropServices.DefaultParameterValue ((null :> obj))>] ?StackGroup: string * [<System.Runtime.InteropServices.Optional; System.Runtime.InteropServices.DefaultParameterValue ((null :> obj))>] ?Orientation: StyleParam.Orientation * [<System.Runtime.InteropServices.Optional; System.Runtime.InteropServices.DefaultParameterValue ((null :> obj))>] ?GroupNorm: StyleParam.GroupNorm * [<System.Runtime.InteropServices.Optional; System.Runtime.InteropServices.DefaultParameterValue ((false :> obj))>] ?UseWebGL: bool * [<System.Runtime.InteropServices.Optional; System.Runtime.InteropServices.DefaultParameterValue ((true :> obj))>] ?UseDefaults: bool -> GenericChart (requires 'c :> System.IConvertible)
static member Chart.Point: x: #System.IConvertible seq * y: #System.IConvertible seq * [<System.Runtime.InteropServices.Optional; System.Runtime.InteropServices.DefaultParameterValue ((null :> obj))>] ?Name: string * [<System.Runtime.InteropServices.Optional; System.Runtime.InteropServices.DefaultParameterValue ((null :> obj))>] ?ShowLegend: bool * [<System.Runtime.InteropServices.Optional; System.Runtime.InteropServices.DefaultParameterValue ((null :> obj))>] ?Opacity: float * [<System.Runtime.InteropServices.Optional; System.Runtime.InteropServices.DefaultParameterValue ((null :> obj))>] ?MultiOpacity: float seq * [<System.Runtime.InteropServices.Optional; System.Runtime.InteropServices.DefaultParameterValue ((null :> obj))>] ?Text: 'c * [<System.Runtime.InteropServices.Optional; System.Runtime.InteropServices.DefaultParameterValue ((null :> obj))>] ?MultiText: 'c seq * [<System.Runtime.InteropServices.Optional; System.Runtime.InteropServices.DefaultParameterValue ((null :> obj))>] ?TextPosition: StyleParam.TextPosition * [<System.Runtime.InteropServices.Optional; System.Runtime.InteropServices.DefaultParameterValue ((null :> obj))>] ?MultiTextPosition: StyleParam.TextPosition seq * [<System.Runtime.InteropServices.Optional; System.Runtime.InteropServices.DefaultParameterValue ((null :> obj))>] ?MarkerColor: Color * [<System.Runtime.InteropServices.Optional; System.Runtime.InteropServices.DefaultParameterValue ((null :> obj))>] ?MarkerColorScale: StyleParam.Colorscale * [<System.Runtime.InteropServices.Optional; System.Runtime.InteropServices.DefaultParameterValue ((null :> obj))>] ?MarkerOutline: Line * [<System.Runtime.InteropServices.Optional; System.Runtime.InteropServices.DefaultParameterValue ((null :> obj))>] ?MarkerSymbol: StyleParam.MarkerSymbol * [<System.Runtime.InteropServices.Optional; System.Runtime.InteropServices.DefaultParameterValue ((null :> obj))>] ?MultiMarkerSymbol: StyleParam.MarkerSymbol seq * [<System.Runtime.InteropServices.Optional; System.Runtime.InteropServices.DefaultParameterValue ((null :> obj))>] ?Marker: TraceObjects.Marker * [<System.Runtime.InteropServices.Optional; System.Runtime.InteropServices.DefaultParameterValue ((null :> obj))>] ?AlignmentGroup: string * [<System.Runtime.InteropServices.Optional; System.Runtime.InteropServices.DefaultParameterValue ((null :> obj))>] ?OffsetGroup: string * [<System.Runtime.InteropServices.Optional; System.Runtime.InteropServices.DefaultParameterValue ((null :> obj))>] ?StackGroup: string * [<System.Runtime.InteropServices.Optional; System.Runtime.InteropServices.DefaultParameterValue ((null :> obj))>] ?Orientation: StyleParam.Orientation * [<System.Runtime.InteropServices.Optional; System.Runtime.InteropServices.DefaultParameterValue ((null :> obj))>] ?GroupNorm: StyleParam.GroupNorm * [<System.Runtime.InteropServices.Optional; System.Runtime.InteropServices.DefaultParameterValue ((false :> obj))>] ?UseWebGL: bool * [<System.Runtime.InteropServices.Optional; System.Runtime.InteropServices.DefaultParameterValue ((true :> obj))>] ?UseDefaults: bool -> GenericChart (requires 'c :> System.IConvertible)
argument x: float seq
<summary>
Creates a Point chart, which uses Points in a 2D space to visualize data.
</summary>
<param name="x">Sets the x coordinates of the plotted data.</param>
<param name="y">Sets the y coordinates of the plotted data.</param>
<param name="Name">Sets the trace name. The trace name appear as the legend item and on hover</param>
<param name="ShowLegend">Determines whether or not an item corresponding to this trace is shown in the legend.</param>
<param name="Opacity">Sets the opactity of the trace</param>
<param name="MultiOpacity">Sets the opactity of individual datum markers</param>
<param name="Text">Sets a text associated with each datum</param>
<param name="MultiText">Sets individual text for each datum</param>
<param name="TextPosition">Sets the position of text associated with each datum</param>
<param name="MultiTextPosition">Sets the position of text associated with individual datum</param>
<param name="MarkerColor">Sets the color of the marker</param>
<param name="MarkerColorScale">Sets the colorscale of the marker</param>
<param name="MarkerOutline">Sets the outline of the marker</param>
<param name="MarkerSymbol">Sets the marker symbol for each datum</param>
<param name="MultiMarkerSymbol">Sets the marker symbol for each individual datum</param>
<param name="Marker">Sets the marker (use this for more finegrained control than the other marker-associated arguments)</param>
<param name="AlignmentGroup">Set several traces linked to the same position axis or matching axes to the same alignmentgroup. This controls whether bars compute their positional range dependently or independently.</param>
<param name="OffsetGroup">Set several traces linked to the same position axis or matching axes to the same offsetgroup where bars of the same position coordinate will line up.</param>
<param name="StackGroup">Set several traces (on the same subplot) to the same stackgroup in order to add their y values (or their x values if `Orientation` is Horizontal). Stacking also turns `fill` on by default and sets the default `mode` to "lines" irrespective of point count. ou can only stack on a numeric (linear or log) axis. Traces in a `stackgroup` will only fill to (or be filled to) other traces in the same group. With multiple `stackgroup`s or some traces stacked and some not, if fill-linked traces are not already consecutive, the later ones will be pushed down in the drawing order</param>
<param name="Orientation">Sets the stacking direction. Only relevant when `stackgroup` is used, and only the first `orientation` found in the `stackgroup` will be used.</param>
<param name="GroupNorm">Sets the normalization for the sum of this `stackgroup. Only relevant when `stackgroup` is used, and only the first `groupnorm` found in the `stackgroup` will be used</param>
<param name="UseWebGL">If true, plotly.js will use the WebGL engine to render this chart. use this when you want to render many objects at once.</param>
<param name="UseDefaults">If set to false, ignore the global default settings set in `Defaults`</param>
argument y: float seq
<summary>
Creates a Point chart, which uses Points in a 2D space to visualize data.
</summary>
<param name="x">Sets the x coordinates of the plotted data.</param>
<param name="y">Sets the y coordinates of the plotted data.</param>
<param name="Name">Sets the trace name. The trace name appear as the legend item and on hover</param>
<param name="ShowLegend">Determines whether or not an item corresponding to this trace is shown in the legend.</param>
<param name="Opacity">Sets the opactity of the trace</param>
<param name="MultiOpacity">Sets the opactity of individual datum markers</param>
<param name="Text">Sets a text associated with each datum</param>
<param name="MultiText">Sets individual text for each datum</param>
<param name="TextPosition">Sets the position of text associated with each datum</param>
<param name="MultiTextPosition">Sets the position of text associated with individual datum</param>
<param name="MarkerColor">Sets the color of the marker</param>
<param name="MarkerColorScale">Sets the colorscale of the marker</param>
<param name="MarkerOutline">Sets the outline of the marker</param>
<param name="MarkerSymbol">Sets the marker symbol for each datum</param>
<param name="MultiMarkerSymbol">Sets the marker symbol for each individual datum</param>
<param name="Marker">Sets the marker (use this for more finegrained control than the other marker-associated arguments)</param>
<param name="AlignmentGroup">Set several traces linked to the same position axis or matching axes to the same alignmentgroup. This controls whether bars compute their positional range dependently or independently.</param>
<param name="OffsetGroup">Set several traces linked to the same position axis or matching axes to the same offsetgroup where bars of the same position coordinate will line up.</param>
<param name="StackGroup">Set several traces (on the same subplot) to the same stackgroup in order to add their y values (or their x values if `Orientation` is Horizontal). Stacking also turns `fill` on by default and sets the default `mode` to "lines" irrespective of point count. ou can only stack on a numeric (linear or log) axis. Traces in a `stackgroup` will only fill to (or be filled to) other traces in the same group. With multiple `stackgroup`s or some traces stacked and some not, if fill-linked traces are not already consecutive, the later ones will be pushed down in the drawing order</param>
<param name="Orientation">Sets the stacking direction. Only relevant when `stackgroup` is used, and only the first `orientation` found in the `stackgroup` will be used.</param>
<param name="GroupNorm">Sets the normalization for the sum of this `stackgroup. Only relevant when `stackgroup` is used, and only the first `groupnorm` found in the `stackgroup` will be used</param>
<param name="UseWebGL">If true, plotly.js will use the WebGL engine to render this chart. use this when you want to render many objects at once.</param>
<param name="UseDefaults">If set to false, ignore the global default settings set in `Defaults`</param>
static member Chart.withDisplayOptionsStyle: [<System.Runtime.InteropServices.Optional; System.Runtime.InteropServices.DefaultParameterValue ((null :> obj))>] ?AdditionalHeadTags: Giraffe.ViewEngine.HtmlElements.XmlNode list * [<System.Runtime.InteropServices.Optional; System.Runtime.InteropServices.DefaultParameterValue ((null :> obj))>] ?ChartDescription: Giraffe.ViewEngine.HtmlElements.XmlNode list * [<System.Runtime.InteropServices.Optional; System.Runtime.InteropServices.DefaultParameterValue ((null :> obj))>] ?PlotlyJSReference: PlotlyJSReference -> (GenericChart -> GenericChart)
union case PlotlyJSReference.Full: PlotlyJSReference
<summary>
Full plotly.js source code (~3MB) is included in the output. HTML files generated with this option are fully self-contained and can be used offline
</summary>
namespace Giraffe
namespace Giraffe.ViewEngine
val desc1: GenericChart
static member Chart.withDescription: chartDescription: XmlNode list -> ch: GenericChart -> GenericChart
val h1: (XmlAttribute list -> XmlNode list -> XmlNode)
val str: (string -> XmlNode)
<summary>
An alias for the `encodedText` function.
</summary>
val p: (XmlAttribute list -> XmlNode list -> XmlNode)
val ol: (XmlAttribute list -> XmlNode list -> XmlNode)
val li: (XmlAttribute list -> XmlNode list -> XmlNode)
type GenericChart =
| Chart of data: Trace * layout: Layout * config: Config * displayOpts: DisplayOptions
| MultiChart of data: Trace list * layout: Layout * config: Config * displayOpts: DisplayOptions
static member addConfig: config: Config -> gChart: GenericChart -> GenericChart
static member addDisplayOptions: displayOpts: DisplayOptions -> gChart: GenericChart -> GenericChart
static member addLayout: layout: Layout -> gChart: GenericChart -> GenericChart
static member combine: gCharts: GenericChart seq -> GenericChart
static member countTrace: gChart: GenericChart -> int
static member existsTrace: predicate: (Trace -> bool) -> gChart: GenericChart -> bool
static member fromChartDTO: dto: ChartDTO -> GenericChart
static member fromFigure: fig: Figure -> GenericChart
static member getConfig: gChart: GenericChart -> Config
static member getDisplayOptions: gChart: GenericChart -> DisplayOptions
...
<summary>
The central type that gets created by all Chart constructors is GenericChart, which itself represents either a single chart or a multi chart (as a Discriminate Union type).
A GenericChart consists of four top level objects: Trace (multiple of those in the case of a MultiChart), Layout, Config, and DisplayOptions.
- `Trace` is in principle the representation of a dataset on a chart, including for example the data itself, color and shape of the visualization, etc.
- `Layout` is everything of the chart that is not dataset specific - e.g. the shape and style of axes, the chart title, etc.
- `Config` is an object that configures high level properties of the chart like making all chart elements editable or the tool bar on top
- `DisplayOptions` is an object that contains meta information about how the html document that contains the chart.
</summary>
static member GenericChart.toChartHTML: gChart: GenericChart -> string
val bulmaHero: XmlNode
val section: (XmlAttribute list -> XmlNode list -> XmlNode)
val _class: (string -> XmlAttribute)
val div: (XmlAttribute list -> XmlNode list -> XmlNode)
val description3: XmlNode list
val desc3: GenericChart
static member Chart.withAdditionalHeadTags: additionalHeadTags: XmlNode list -> ch: GenericChart -> GenericChart
val link: attr: XmlAttribute list -> XmlNode
val _rel: (string -> XmlAttribute)
val _href: (string -> XmlAttribute)
val mathtex_chart: GenericChart
static member Chart.combine: gCharts: GenericChart seq -> GenericChart
static member Chart.withTitle: title: Title -> (GenericChart -> GenericChart)
static member Chart.withTitle: title: string * [<System.Runtime.InteropServices.Optional; System.Runtime.InteropServices.DefaultParameterValue ((null :> obj))>] ?TitleFont: Font -> (GenericChart -> GenericChart)
static member Chart.withMathTex: [<System.Runtime.InteropServices.Optional; System.Runtime.InteropServices.DefaultParameterValue ((true :> obj))>] ?AppendTags: bool * [<System.Runtime.InteropServices.Optional; System.Runtime.InteropServices.DefaultParameterValue ((3 :> obj))>] ?MathJaxVersion: int -> (GenericChart -> GenericChart)